
2 Ain't Enough

I read a post on Substack the other day and the poster used the number 2. And I pointed out there that… 2 ain’t enough.
What am I talking bout? Demographics, my Dear Watson! Demographics!

2.2
It is tempting to think that if every couple has two children, then the society will reproduce itself. It makes sense, no? Two people have two people who have two people…
2 → 2 → 2 → 2…
But, alas, demographics does not deal with pure math. Demographics deals with real people and so the number you’re actually looking for is 2.2.
You see, unfortunately, those two children that the couple had do not always grow up and havre children. Sometimes they die in infancy, sometimes they die in childhood, sometimes they die in war before they marry… or even a woman dies before she had both of her scheduled children!
And there are those who are infertile, both male and female. So two do not always lead to two which lead to two which lead to two. The modern math (ie in an age without massive infant mortality, war, famine, plague, etc) is that two needs to lead to two point two, which then leads to two, which then leads to two point two, etc.
2 → 2.2 → 2 → 2.2…
0 ≠ 2
And then you have those who choose not to marry, not to have children. They have zero children. And yet we often miss them when thinking about the ‘average being two’ (or, as we have seen, more than two). But we need to remember… TFR means that every woman has to have that many children… or that the women who don’t need to be made up for by the women who do.
When we look around, when we are standing in our church our in Walmart and see the couple with two children, and we think that they are almost there! That they are just short of reproducing! But we forget that we just passed another couple with zero children, or a woman not even married. Which means the next couple we pass, who has three children, may not have enough children for us to reach even 2.2!
Let’s run the numbers. Let us suppose that for every one hundred couples in our society, fully fifty percent of these decide not to marry or not to have children. (We have already included those who can’t have children in our 2.2). What does that mean for the other fifty couples? It would mean that in order to achieve a TFR of 2.2 the TFR of the women who do have children would have to be… 4.4!
100 (couples) → 50 (childbearing couples) → 50 (childbearing women) → 220 (children) → 100 (couples, surviving to age of reproduction)
Or if it is clearer:
100 women → 50 women willing to have children → 220 (children) → 110 (girls) → 100 (girls who survive to age of reproduction)
Cohort
Now we come to a bit of tricky math. A bit of math that, in general, our ancestors would never have had to do. You see, the way that demographics have worked in pretty much all of the past (monogamy and war would distort this) is that today’s women have today’s children, and today’s children become tomorrow’s women. The whole thing was kind of like an escalator: with each new kid popping out of the machine at just the right time and the preceding steps going upwards like all the other steps.
But unlike an escalator, the steps are not all the same size. Going back to our two-point-two analysis in the beginning, for a society to even reproduce itself, the bottom steps have got to be bigger than the top ones. And as the steps slid upward, they got smaller and smaller until they vanished altogether.
The ordinary way that this gets represented is with a pyramid. A broad base with a slightly smaller next step on top of it, and then a slightly smaller one, all leading up to the top. Historically, this pyramid has represented population growth, but it would also work, if needing to be exactly balanced, for a society that merely reproduced itself.
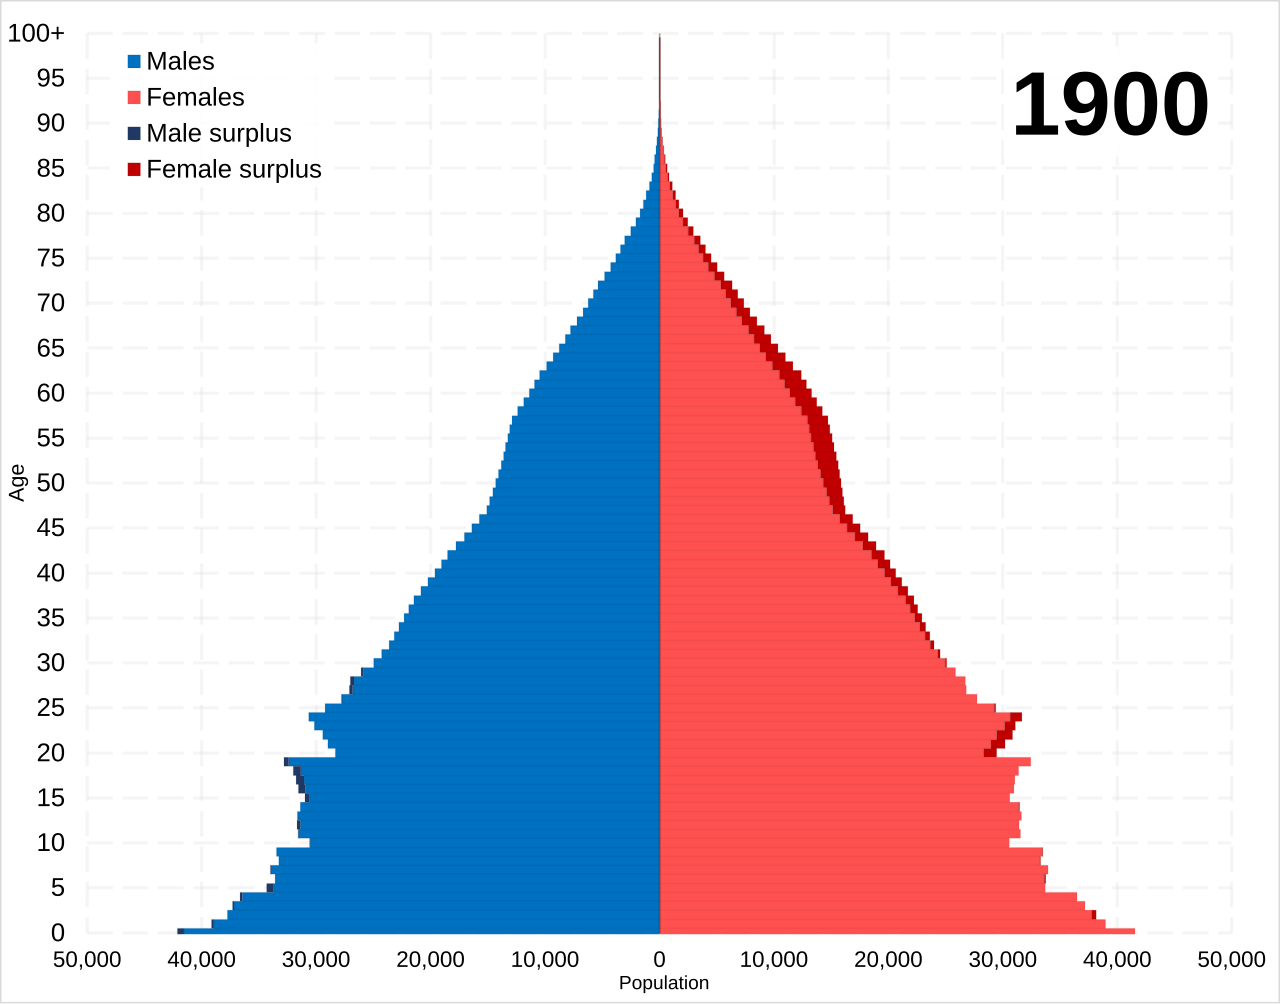
(The ideal pyramid would be smooth all the way down, but nothing human is smooth. However you can plainly see the slope from the eighty five year olds to the zero year olds, and the overall pyramid shape.)
But recently our pyramid has gotten out of shape. The bottom of the pyramid, the very bottom, which represents new children, is smaller than some of the steps above it. And as the escalator has moved upwards, to mix our metaphors, we have reached the point where the small steps include child-producing women.
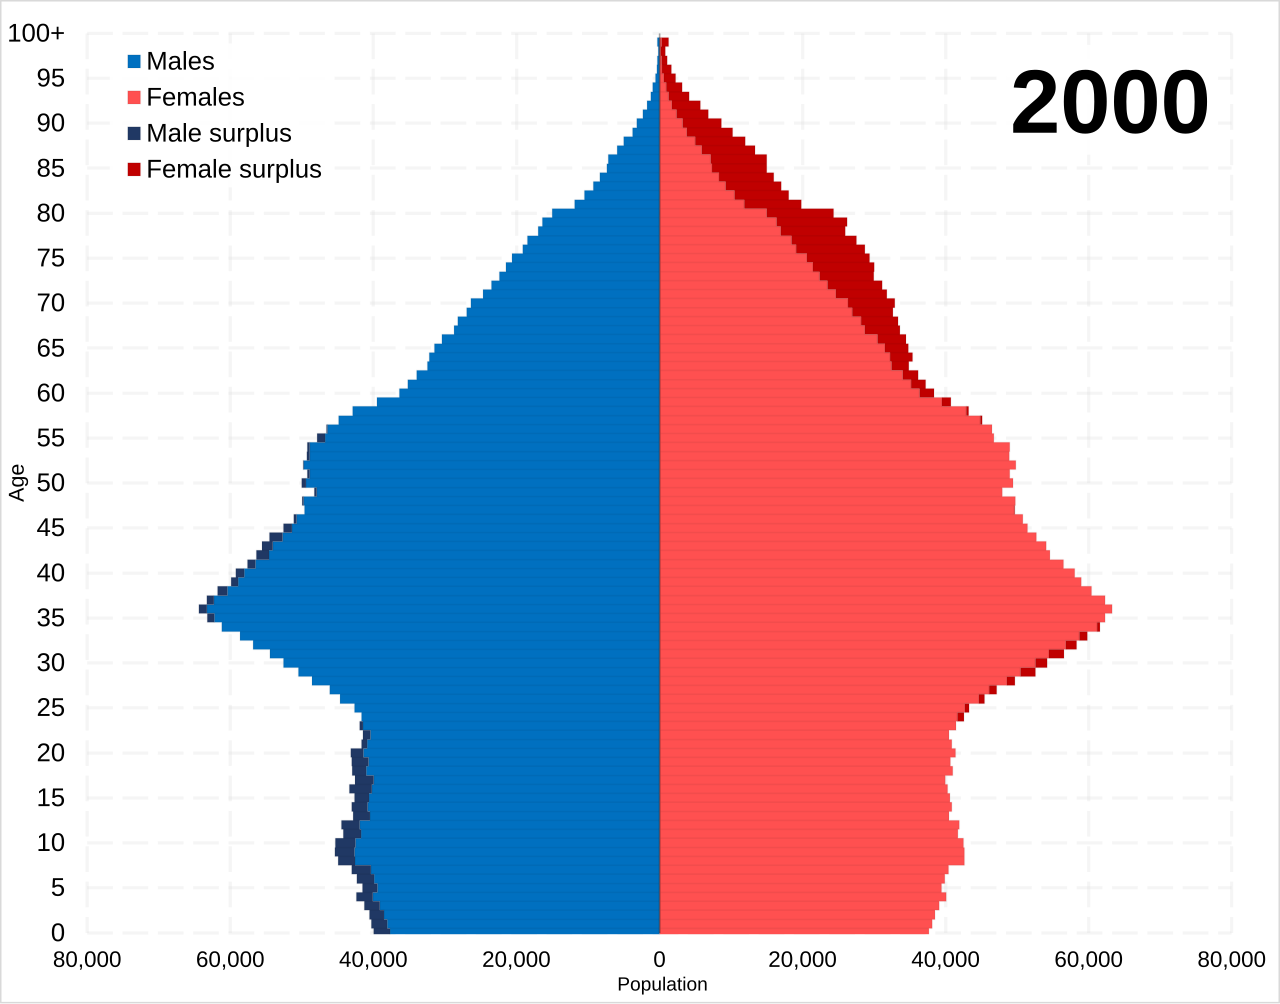
(Note, the above images were taken from the Wikipedia. Notice the date on the later one: 2020. So you will have to project this pyramid 25 years upward… with the gap that started at year 35 now starting at year 60, and the low point that shows at 25 now being year fifty, and the diminishing numbers at year zero now being peak fertility of year 25!)
Now, in the past, what has been happening is that the steps which represented childbearing women produced the steps which represented children. And so, if we were to take away all of the other stops except these two sets. We would see that the two-point two number representing the child step is just that little bit bigger than the child-bearing woman's step. But in the past, all of those steps were part of a pyramid.
But if we replace the normal pyramid shape with our modern non-pyramid pyramid shape, with its dramatically smaller child-bearing women step, along with the smaller children step that it would produce, and then add the rest of the pyramid back in, we would see that the ‘children’ step was not big enough to support the pyramid.
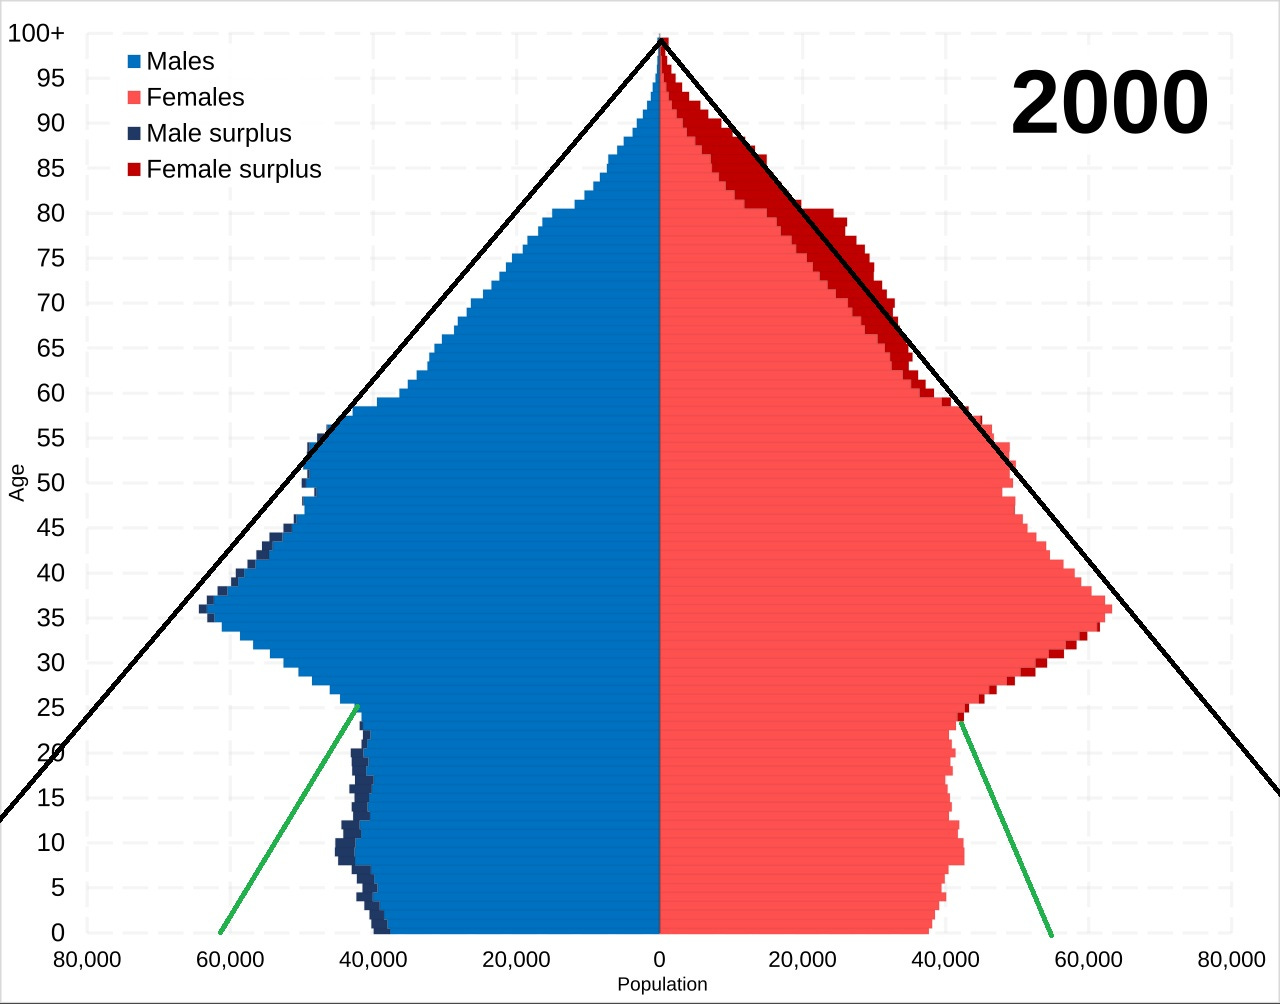
(So, keeping in mind the 2020 problem, the green line represents the children that would be produced if the women of childbearing age were to ‘normally’ reproduce. The black lines (which extend off this screen) represent the number that would be needed for an actual pyramid. The difference is the demographic gap that is so catastrophic).
The problem here goes under the word ‘cohort’. The problem is that the child-bearing cohort is too small to fit into its place in the overall population pyramid. So it’s not good enough that the child-bearing cohort merely produce the number of children that would work in an ordinarily shaped pyramid. It must produce a vastly oversized number of children in order to rebalance the pyramid.
Multiplicative
Sp of we start with the need for 2.2 in a normally shaped pyramid, and then we realised that that 2.2 might need to become as hight as 4.4 once we translate it into the number of women who are actually willing and able to have children, we then have to multiply that 4.4 to make up for whatever deficit our diminished child-bearing size requires.
So when we look around and see the happy family with one boy and one girl we need to realise that in the face of our demographic death spiral, they don’ cut it. They don’t even come close.
Normia
Let us invent a country. We will call it ‘Normia’. Here’s what their population pyramid used to look like:
Age Population (rounded)
80+ 10 million
70-79 11 m
60-69 12.1 m
50-59 13.3 m
40-49 14.6 m
30-39 16.1 m
20-29 17.7 m
10-19 19.5 m
0-9 21.4 m
So here we see that for every retiree 70+ years old there are 7.39 people in the working age cohort (20-69).
Now, instead of fooling around with a whole lot of fancy math lets just take the exact same population pyramid with a greatly reduced TFR over the last forty years.
Age Population (rounded)
80+ 10 million
70-79 11 m
60-69 12.1 m
50-59 13.3 m
40-49 14.6 m
30-39 11.7 m
20-29 9.4 m
10-19 7.5 m
0-9 5.9 m
This pyramid gives us 4.7 working age people per retiree.
And not let us consider the child-bearing cohort problem. In the first pyramid the number of women between the ages of twenty to forty was 16.9 million. The number of children between zero to twenty years old was approximately 40 million; which gives us a ration of 2.4 children per child bearing woman.
If were now take that same 2.4 number and use it on our updated, modernised population pyramid we would end up with 25.2 million children… or a deficit of 14.8 million children. If, on the other hand, the modern child-bearing cohort were to attempt to adequately fill the bottom of the pyramid, their number would have to be not 2.4 but 3.89. And that’s the average! That’s ignoring women who can’t have children, don’t get married, refuse or choose not to have children… The burden on those who can have and do choose to have children would be much higher.
(The discerning reader will notice a difference between the 2.2 TFR needed to sustain a modern population and the 2.4 number we quote above. There are two reasons for this:
We made this pyramid up, we did not calculate it in great detail.
Because women do not all have their children all at the same time in some clutch at some exact age in her life, but instead has them spread out over various years and thus ages, some of the older children would no doubt have come from women outside of our ‘child-bearing cohort’, and the younger portion of that cohort (say, the 21 year old woman) has not had all of her children yet.
However, while both of those issues are true for this chart, and thus it does not represent an exact and detailed mathematical analysis… the problems it presents are absolutely true.)
And the problem gets worse as the escalator continues upward. The upper steps start becoming filled with older people, and the lower steps with fewer and fewer working age people to support them… and the entire economy.
This problem is also exacerbated by a lack of political will to deal with the issue. Just this week I read that the government of France, which recognizes the problem that their pension system represents as their people age into it without younger workers, has just had to drop any plans for dealing with it… as none of the political parties are willing to touch it.

2 B or not 2 B
In the short term, this is a political problem. The numbers will look worse and worse for various government problems, and the potential short term solutions fewer and fewer and more and more desperate.
But in the long run, this is an existential problem. A problem that, if not dealt with, will lead to the actual destruction of countries and peoples that do not deal with it.
Note: If anyone is tempted to think ‘well, we will just import workers’, see my “Math of Fertility” post below.
Thank you for reading Von’s Substack. I would love it if you commented! I love hearing from readers, especially critical comments. I would love to start more letter exchanges, so if there’s a subject you’re interested in, get writing and tag me!
Being ‘restacked’ and mentioned in ‘notes’ is very important for lesser-known stacks so… feel free! I’m semi-retired and write as a ministry (and for fun) so you don’t need to feel guilty you aren’t paying for anything, but if you enjoy my writing (even if you dramatically disagree with it), then restack, please! Or mention me in one of your own posts.
If I don’t write you back it is almost certain that I didn’t see it, so please feel free to comment and link to your post. Or if you just think I would be interested in your post!
If you get lost, check out my ‘Table of Contents’ which I try to keep up to date.
Thanks again, God Bless, Soli Deo gloria,
Von
Links
Depopulation Solutions

John Carter published an article entitled Depopulocalypse III – From SINK to FLOAT. In it, he was talking about solutions for the depopulation crisis. It was behind a paywall but has since come out. I recommend you read the article and the entire series. His solutions are interesting and cover a wide range of issues.
The Modern Problem with Math

Reading modern fiction, especially science-fiction, but also a lot of fantasy, will lead one to believe that modern people are incapable of doing math. They seem incapable of seeing that while one plus one may equal two, two cannot remain two in most circumstances.
The Math of Fertility

If a society were to try to recover from a demographic cliff, what would the math be like? Well, one thing for sure is that it wouldn’t merely be a matter of going back to old trends. Old trends worked for old trends, they won’t work to correct new trends.
MPAP
I had Copilot write up an idea that I had. After a few iterations, this is what it came up with. Keeping in mind the weakness of AI writing… what do you think of this idea?
No Kids Allowed

Sometimes when people begin to speak about increasing fertility, attempting to get us off the demographic cliff we are on, the issue of ‘daycare’ comes up. I would like to propose the opposite solution. I would like to eliminate ‘no kids allowed’.
Lots of Kids

I have commented on several notes here on Substack recently. Each of them proports to list the qualities of a Godly man, or somesuch. The lists had some interesting things in them (although many of them seemed to be lacking Scriptural backing) but they frequently left out marriage, left out having children or…
Blessings of the Breasts and the Womb

Intro So, J.S. Kasimir has posted a response in the ‘Inevitability of Patriarchy’ letter exchange. I definitely advise you to read it. As I read it, it is about 1/3 dealing with the issue, and 2/3 combination wishful thinking and hope for the future.
The Scriptures vs Natural Family Planning

A sower went out to sow his seed: and as he sowed, some fell by the way side; and it was trodden down, and the fowls of the air devoured it.

INCHEL

From time to time, the internet is awash with discussions of men said to be ‘INCEL’: men who are involuntarily celibate (ie who would wish to have sex, but are not doing so for reasons they consider beyond their control). The definition and the discussion, range wildly from that point, but I would like to put forward another word for another group. The …
Virginity, Chastity and Children

One of the biggest differences between a natalist and an anti-natalist culture has to do with what one might call ‘stages of life’. There are several different ways to talk about these stages, but the most significant for our purposes might be the divide between virginity and chastity.
Single Income Lots of Kids

The internet is awash with acronyms for social groups, especially modern social groups. You have ‘INCEL’, which at its core stands for ‘involuntarily celibate’; and usually refers to a young man who wishes to date, marry, have sex etc but cannot manage it. You have ‘INCHEL’, which I made up for a group that is less well-known but very real: young women …